Search results
Search for "absorption spectra" in Full Text gives 250 result(s) in Beilstein Journal of Nanotechnology. Showing first 200.
Photocatalytic degradation of methylene blue under visible light by cobalt ferrite nanoparticles/graphene quantum dots
Beilstein J. Nanotechnol. 2024, 15, 475–489, doi:10.3762/bjnano.15.43

- electrons and holes. These results suggest that the CoFe2O4/GQD nanocomposite is a potential catalyst for methylene blue degradation and various environmental applications. XRD patterns of (a) CF and (b) CF/GQDs. (a) UV–vis absorption spectra of the GQD solution; inset: GQD solution under white light (left


CdSe/ZnS quantum dots as a booster in the active layer of distributed ternary organic photovoltaics
Beilstein J. Nanotechnol. 2024, 15, 144–156, doi:10.3762/bjnano.15.14

- -transporting layers [24], active absorbing layers, and other components [25][26]. Inorganic quantum dots are considered substitutes for fullerene acceptors. Their biggest advantages are a tunable band gap, various absorption spectra, and comparatively high mobility of carriers [27][28]. The application of
- in the millivolt region. The biggest change in performance concerned the short-circuit current. Conclusion Absorption spectra of the studied QDs indicate the role of a second acceptor (non-fullerene acceptor [62]) in the heterojunction volume. We may also consider QD materials as donors. By
- establish absorption spectra and confirm excited states proven by luminescence. The dispersive spectra of the refractive index and extinction coefficient of nanoshell nanolayers and nanoshell:donor:acceptor composites were also determined. The dopant QDs shifted the extinction maximum toward longer


Properties of tin oxide films grown by atomic layer deposition from tin tetraiodide and ozone
Beilstein J. Nanotechnol. 2023, 14, 1085–1092, doi:10.3762/bjnano.14.89

- eV binding energy, whereas the peak at 5 eV is not as dominant [28][29][35]. X-ray absorption spectra (Figure 11) were additionally recorded to possibly detect any differences between the samples. The Sn 3d XAS band is constituted by transitions from the 3d core orbital to the unoccupied p and f


A visible-light photodetector based on heterojunctions between CuO nanoparticles and ZnO nanorods
Beilstein J. Nanotechnol. 2023, 14, 1018–1027, doi:10.3762/bjnano.14.84

- JCPDS card No. 01-080-0076. This is proof of the existence of CuO NPs in the CuO NPs/ZnO NRs structure. Figure 2b shows the UV–vis absorption spectra of the pure ZnO NRs and ZnO NRs decorated with CuO NPs. Both samples containing ZnO NRs have absorption edges in a wavelength range from 300 to 380 nm due
- ) characteristics and current–time (I–t) curves (Keithley 2400). Visible detection measurements were performed using LEDs with different wavelengths (395, 464, 532, and 640 nm). FESEM images of (a) pure ZnO NRs and (b) CuO NPs/ZnO NRs; (c) EDS spectrum of CuO NPs/ ZnO NRs. (a) XRD patterns and (b) UV–vis absorption
- spectra of the pure ZnO NRs and CuO NPs/ZnO NRs. (a) I–V characteristics and (b) I–t curves of the photodetector based on CuO NPs/ZnO NRs heterojunctions under 395 nm exposure with different light intensities. I–t curves after three cycles under 395 nm visible-light illumination with two power densities


Nanoarchitectonics of photothermal materials to enhance the sensitivity of lateral flow assays
Beilstein J. Nanotechnol. 2023, 14, 988–1003, doi:10.3762/bjnano.14.82

- to CC BY 4.0.). Comparison of absorption spectra of different sizes Au-nanorods (C). Maximum temperature raising profile with respect to absorption cross-section of Au-nanorods (D). (Figure 5C and D was reproduced from [48] (© 2022 J.-P. Sun et al., published by Elsevier, distributed under the terms


Isolation of cubic Si3P4 in the form of nanocrystals
Beilstein J. Nanotechnol. 2023, 14, 971–979, doi:10.3762/bjnano.14.80

- agglomeration for at least a month. The synthesized samples were brown powders that formed brown sols in acetonitrile, quite similar in appearance to those of Si NPs. Upon examination of the UV–vis absorption spectra, a bandgap of 1.25 eV was established using Tauc plot (Figure 5). A simpler approach for a


Upscaling the urea method synthesis of CoAl layered double hydroxides
Beilstein J. Nanotechnol. 2023, 14, 927–938, doi:10.3762/bjnano.14.76

- , P2, S1, and S2, respectively. UV–vis absorption spectra of the solid samples were recorded in reflectance mode employing a Jasco V-670 spectrometer. Thermogravimetric analysis (TGA) was carried out on a Netzsch TG 209 F1 Libra instrument in the 30–900 °C temperature range. Magnetic data were


Silver-based SERS substrates fabricated using a 3D printed microfluidic device
Beilstein J. Nanotechnol. 2023, 14, 793–803, doi:10.3762/bjnano.14.65

- , TESCAN). A UV–vis spectrometer (Agilent 8453, Agilent, USA) and a micro-Raman spectrometer (NS200, Nanoscope System, Republic of Korea) were used to record the absorption spectra and Raman spectra, respectively. Fabrication of the droplet-based microfluidic device The fabrication process of the


Silver nanoparticles loaded on lactose/alginate: in situ synthesis, catalytic degradation, and pH-dependent antibacterial activity
Beilstein J. Nanotechnol. 2023, 14, 781–792, doi:10.3762/bjnano.14.64

- . Subsequently, AgNPs@Lac/Alg was characterized using various analytical techniques and applied for the catalytic degradation of contaminants and in bacterial activity assays. Absorption spectra were analyzed to monitor changes in physicochemical properties at the maximum peak region of surface plasmon resonance


Metal-organic framework-based nanomaterials as opto-electrochemical sensors for the detection of antibiotics and hormones: A review
Beilstein J. Nanotechnol. 2023, 14, 631–673, doi:10.3762/bjnano.14.52

- states produced by this method are “charge-separated” states. The emission and absorption spectra make it simple to discriminate between PET and ICT. Although there is a significant quenching of luminescence intensity in PET, there is no visible spectral shift. Contrarily, ICT yields environment


SERS performance of GaN/Ag substrates fabricated by Ag coating of GaN platforms
Beilstein J. Nanotechnol. 2023, 14, 552–564, doi:10.3762/bjnano.14.46

- absorption spectra of the GaN platform and the GaN/Ag SERS substrates fabricated using MS and PLD at different temperatures are shown in Figure 5. The spectrum of GaN shows the typical spectral shape of a broadband semiconductor with an absorption edge around 365 nm (3.4 eV). The spectra of all GaN/Ag


A mid-infrared focusing grating coupler with a single circular arc element based on germanium on silicon
Beilstein J. Nanotechnol. 2023, 14, 478–484, doi:10.3762/bjnano.14.38

- is called “fingerprint spectrum region” (FSR) [1][4]. Many small biological molecules have unique and identifiable absorption spectra in the MIR band of 6–15 μm [1][5]. It is of great application value to develop photonic biosensors in this FSR. The spectral transparency window of germanium can fully


Mixed oxides with corundum-type structure obtained from recycling can seals as paint pigments: color stability
Beilstein J. Nanotechnol. 2023, 14, 467–477, doi:10.3762/bjnano.14.37

- sample 2. The spectra confirm the oxidation state 3+ in all samples (Al3+, Cr3+, and Fe3+). UV–vis absorption spectra of (a) sample 1 and (b) sample 2, both confirming the oxidation state 3+ of the coloring ions. Distribution of samples according to the hue value (h*): alumina (87.20), sample 1 (80.65
- Information File 4: Additional experimental data. XRD and SEM of the samples, absorption spectra, reflectance spectra, and colorimetric parameters of the oxides and samples. Funding D. F. L. H, J. d. O. P., and N. B. appreciate the Coordenação de Aperfeiçoamento de Pessoal de Nível Superior-Brasil (CAPES


Conjugated photothermal materials and structure design for solar steam generation
Beilstein J. Nanotechnol. 2023, 14, 454–466, doi:10.3762/bjnano.14.36

- tunability of molecular structures [5][6]. In fact, there is a long development history of conjugated molecules and polymers, and a clear correlation between their chemical structure and physical properties has been established [7][8][9][10][11][12][13][14][15][16][17]. For example, the absorption spectra
- but not EW end groups. In contrast, DPP-DCV and DPP-INCN have -DCV and -INCN-based EW end groups, respectively. The absorption spectra of the DPP derivatives bathochromically shifted due to the ICT band, and its extinction coefficient increased in the order from DPP-H to DPP-DCV and further to DPP
- International License, https://creativecommons.org/licenses/by-nc/4.0). This content is not subject to CC BY 4.0. Part (a) of the source was redrawn from [24] and part (b) was inspired by [25]. (a) Chemical structures of DPP-H, DPP-DCV, and DPP-INCN and optical absorption spectra of the DPP derivatives (b) in


Evaluation of electrosynthesized reduced graphene oxide–Ni/Fe/Co-based (oxy)hydroxide catalysts towards the oxygen evolution reaction
Beilstein J. Nanotechnol. 2023, 14, 420–433, doi:10.3762/bjnano.14.34
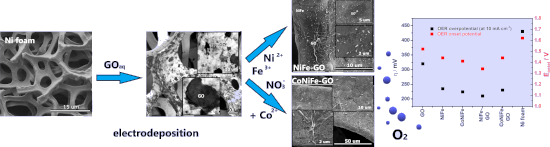
- Figure 3a–d shows the X-ray absorption spectra (XAS) of the L3 edge of nickel (a), iron (b), cobalt (c), and carbon (d) in the studied catalysts. The appearance of a shoulder peak at the L3 edge of the nickel (Figure 3a) at 855 eV indicates the presence of oxides in the structure of the catalysts (Ni in


Plasmonic nanotechnology for photothermal applications – an evaluation
Beilstein J. Nanotechnol. 2023, 14, 380–419, doi:10.3762/bjnano.14.33


Quercetin- and caffeic acid-functionalized chitosan-capped colloidal silver nanoparticles: one-pot synthesis, characterization, and anticancer and antibacterial activities
Beilstein J. Nanotechnol. 2023, 14, 362–376, doi:10.3762/bjnano.14.31

- nanoparticles The absorption spectra of quercetin, caffeic acid, chitosan, Ch-, Ch/Q-, and Ch/CA-Ag NPs were recorded on a UV–vis double-beam spectrophotometer (Hitachi U-2900) at wavelengths of 200 to 800 nm at 1.0 nm intervals with a quartz cell of 1.0 cm light path. Fourier-transform infrared (FTIR) spectra
- the absorption spectra is also reflected in the color of nanoparticle solutions (see Figure 2d). Compared to the reference sample (i.e., Ch-Ag NPs), new absorption shoulders appeared at the higher energy side of the spectra (i.e., at about 200 and 345 nm) in the modified chitosan structure with
- the concentration of phenolics. Figure 5c shows the absorption spectra of pure caffeic acid (inset graph) and caffeic acid–FC–Na2CO3 mixtures. The calibration curve was obtained using absorbance values at 762 nm (Figure 5d). Since the phenolic content will be proportional to the amount of caffeic acid


Non-stoichiometric magnetite as catalyst for the photocatalytic degradation of phenol and 2,6-dibromo-4-methylphenol – a new approach in water treatment
Beilstein J. Nanotechnol. 2022, 13, 1531–1540, doi:10.3762/bjnano.13.126

- previous publication of ours [19]. The absorption spectra of the catalysts showed noticeable differences (Figure 1b). Using the absorption spectra, the electron gap energies for M1 and M2 were determined to be 0.11 V and 1.75 V, respectively (Table 1) [20]. Phase identification of the magnetite structure
- multimeter (CPC 411, Elmetron, Poland). External standards of seven concentration levels ranging from 1 × 10⁻⁵ to 1 × 10⁻³ mol·L−1 were used to quantify bromide ions. X-ray diffraction measurements of M1 (red), M2 (blue) (a), and UV–vis absorption spectra of M1 (red) and M2 (blue) (b). Figure 1a and 1b were


In search of cytotoxic selectivity on cancer cells with biogenically synthesized Ag/AgCl nanoparticles
Beilstein J. Nanotechnol. 2022, 13, 1505–1519, doi:10.3762/bjnano.13.124

- give rise to a collective oscillation known as surface plasmon effect [34]. This effect can be monitored by UV–vis spectroscopy, where metal nanoparticles absorb radiation at different wavelengths depending on their size [36]. The UV–vis absorption spectra of the reactions at different temperatures are


Facile preparation of Au- and BODIPY-grafted lipid nanoparticles for synergized photothermal therapy
Beilstein J. Nanotechnol. 2022, 13, 1432–1444, doi:10.3762/bjnano.13.118

- –visible (UV–vis) absorption spectra were measured with an UV–vis spectrometer (Q-5000, Quawell, America). The amounts of BDP in AB-LNPs were analyzed using UV–vis spectroscopy after the dissolution of AB-LNPs in DMSO by measuring the absorbance at a wavelength of 600 nm. The loading efficiency (LE, %) was


Green synthesis of zinc oxide nanoparticles toward highly efficient photocatalysis and antibacterial application
Beilstein J. Nanotechnol. 2022, 13, 1108–1119, doi:10.3762/bjnano.13.94

- Equation 3. Figure 8 shows the degradation absorption spectra of MO and MB by synthesized ZnO under visible and UV light for different time intervals. The intensity of the peak decreased with increasing irradiation time. The results in Figure 9 show that the degradation efficiency of MB and MO solutions


Recent advances in green carbon dots (2015–2022): synthesis, metal ion sensing, and biological applications
Beilstein J. Nanotechnol. 2022, 13, 1068–1107, doi:10.3762/bjnano.13.93


Solar-light-driven LaFexNi1−xO3 perovskite oxides for photocatalytic Fenton-like reaction to degrade organic pollutants
Beilstein J. Nanotechnol. 2022, 13, 882–895, doi:10.3762/bjnano.13.79

- microscopy (FESEM). The light absorption spectra of the perovskite oxides were inspected using V-670 (Jasco, Japan) to examine the UV–vis absorption capability with diffuse reflectance spectroscopy (DRS) from 200 to 800 nm. The nitrogen adsorption–desorption analyzer, ASAP 2020 PLUS (ASAP, USA), was applied


Efficient liquid exfoliation of KP15 nanowires aided by Hansen's empirical theory
Beilstein J. Nanotechnol. 2022, 13, 788–795, doi:10.3762/bjnano.13.69

- concentrations of KP15 dispersions in butyrolactone were prepared by liquid exfoliation with a predetermined concentration. UV−visible absorption spectra results are shown in Figure 2. The concentration linearly varies with absorbance. The slope of this fitted linear equation is 3.86 ± 0.13. This means that the


A nonenzymatic reduced graphene oxide-based nanosensor for parathion
Beilstein J. Nanotechnol. 2022, 13, 730–744, doi:10.3762/bjnano.13.65

- (ULVAC-PHI, U.S.) with monochromatic Al Kα (hν = 1486.6 eV) radiation, and a beam size of 100 μm. The Fourier transform infrared (FTIR) absorption spectra of GO and ERGO were collected in the 4000–400 cm−1 region on a Perkin Elmer spectrometer as KBr (Sigma-Aldrich, Germany) pellets. The crystalline
- : CV of ERGO/GCE at different scan rates (10–300 mV/s) in 1.0 mM K3Fe(CN)6 solution with 1 M KCl. Figure S2: (A) Storage stability of the proposed sensing matrix (ERGO/GCE), (B) SWV of PT (1.5, 2.5, 5 μM) added in groundwater. Figure S3: (A) Absorption spectra of parathion and (B) corresponding


